
Bollinger Bands Strategy remains one of the most trusted technical analysis methods for identifying market volatility, spotting trend reversals, and improving trade timing. Whether you trade Forex, commodities, indices, cryptocurrencies, or stocks, understanding how Bollinger Bands work can significantly improve your trading decisions.
Many traders struggle with entering trades too early, exiting profitable positions too soon, or holding losing trades for too long. These challenges often stem from the inability to measure market volatility accurately. Bollinger Bands solve this problem by helping traders understand when prices are relatively high or low compared to recent market conditions.
This comprehensive guide explains how Bollinger Bands Strategy works, how professional traders use it, common mistakes to avoid, and practical techniques that can improve your trading performance. If applied correctly alongside sound risk management, Bollinger Bands can become an essential part of any trading strategy.
What Is Bollinger Bands Strategy?
Bollinger Bands Strategy is a technical trading method developed by renowned financial analyst John Bollinger during the early 1980s. The indicator measures market volatility while providing traders with dynamic support and resistance levels. Unlike fixed price channels, Bollinger Bands automatically expand when volatility increases and contract when volatility decreases. Consequently, traders can easily identify periods of strong momentum and potential market reversals.
The indicator consists of three important components. The middle band represents a 20-period Simple Moving Average (SMA), which reflects the average market price over the selected period. The upper band is calculated by adding two standard deviations to the moving average. This band highlights areas where prices are relatively expensive. The lower band is created by subtracting two standard deviations from the moving average. It represents areas where prices are relatively inexpensive.
Because the bands adjust continuously according to price movement, traders receive real-time insights into changing market conditions instead of relying on static price levels.
Why Bollinger Bands Matter in Modern Trading
Financial markets have become increasingly volatile due to global economic uncertainty, changing interest rates, inflation reports, central bank decisions, geopolitical developments, and AI-driven algorithmic trading systems. As a result, volatility-based indicators have become more valuable than ever. Bollinger Bands help traders answer several important questions before entering a trade.
Is the market trending or ranging? Is volatility increasing or decreasing? Is the current move likely to continue or reverse? Has the market become overextended? Instead of relying on emotions, traders can use Bollinger Bands to make objective decisions based on market behavior.
How Bollinger Bands Are Calculated
Understanding the calculation helps traders interpret the indicator more effectively. The middle line represents a 20-period moving average. The upper band equals the moving average plus two standard deviations. The lower band equals the moving average minus two standard deviations. Standard deviation measures price volatility. Therefore, when market volatility rises, the bands widen automatically. Conversely, when volatility declines, the bands become narrower.
This adaptive nature makes Bollinger Bands useful across multiple market conditions.
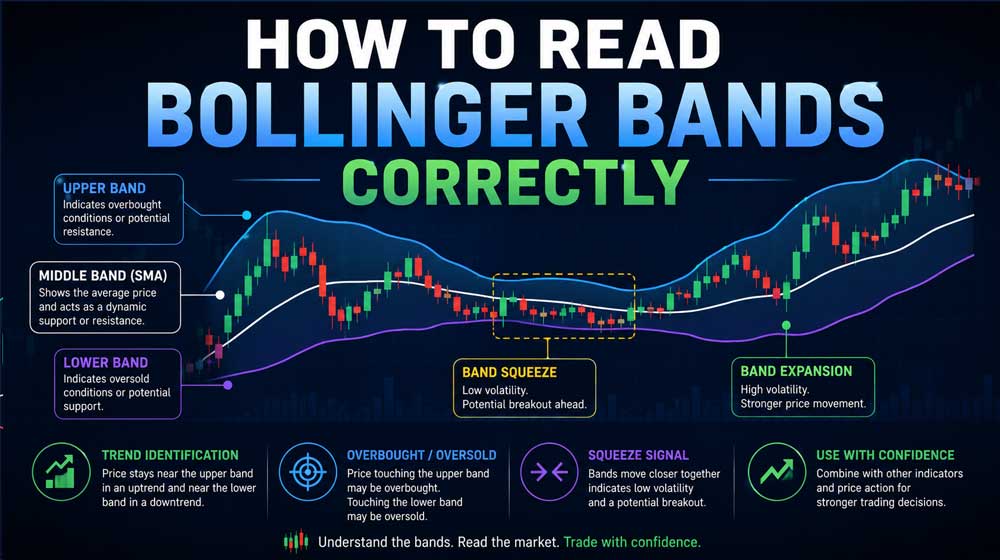
How to Read Bollinger Bands Correctly
Many beginners incorrectly assume that touching the upper band means selling and touching the lower band means buying. However, professional traders understand that price touching either band only signals increased momentum rather than an automatic reversal. When prices repeatedly ride the upper band, buyers remain in control. When prices continuously move along the lower band, sellers dominate the market.
Therefore, context always matters. Successful traders combine Bollinger Bands with price action, trend analysis, volume, and confirmation indicators before making trading decisions.
Best Bollinger Bands Trading Strategies
Bollinger Band Squeeze Strategy
The Bollinger Band Squeeze is one of the most popular volatility breakout strategies. During periods of low volatility, the bands contract significantly. This phenomenon indicates that the market is consolidating before a major price movement. Although the squeeze itself does not predict direction, it signals that a strong breakout may occur soon. Professional traders wait for price confirmation before entering trades rather than guessing the breakout direction.
A breakout above resistance with rising trading volume often confirms bullish momentum. Similarly, a breakdown below support with increasing volume often confirms bearish momentum. Since false breakouts frequently occur, experienced traders wait for candle confirmation before entering positions.
Bollinger Band Breakout Strategy
Markets often experience explosive moves after prolonged consolidation. When price closes decisively outside the Bollinger Bands, it may indicate the beginning of a strong trend. However, traders should avoid chasing every breakout. Instead, confirmation through higher trading volume, momentum indicators, and broader market structure significantly improves trading accuracy. Because breakouts frequently align with major economic announcements, monitoring financial calendars also becomes essential.
Bollinger Band Reversal Strategy
Markets rarely move in one direction forever. Eventually, strong buying or selling pressure weakens, allowing price to reverse toward its average value. When prices extend significantly beyond the upper band while momentum slows, traders often look for bearish reversal confirmation. Likewise, when prices remain far below the lower band while selling pressure decreases, bullish reversal opportunities may emerge. Candlestick patterns such as Doji, Hammer, Shooting Star, Engulfing Candles, and Morning or Evening Stars provide additional confirmation before entering trades.
Bollinger Bands Trend Following Strategy
Trend-following remains one of the most reliable approaches for long-term trading success. Rather than attempting to predict reversals, many experienced traders simply trade in the direction of the prevailing trend. During strong uptrends, prices frequently stay near the upper band while respecting the middle moving average.
During strong downtrends, prices generally remain close to the lower band. Instead of selling during strong bullish momentum, trend traders wait for pullbacks toward the middle band before looking for new buying opportunities. This approach helps improve risk-reward ratios while reducing emotional trading.
Combining Bollinger Bands with Other Technical Indicators
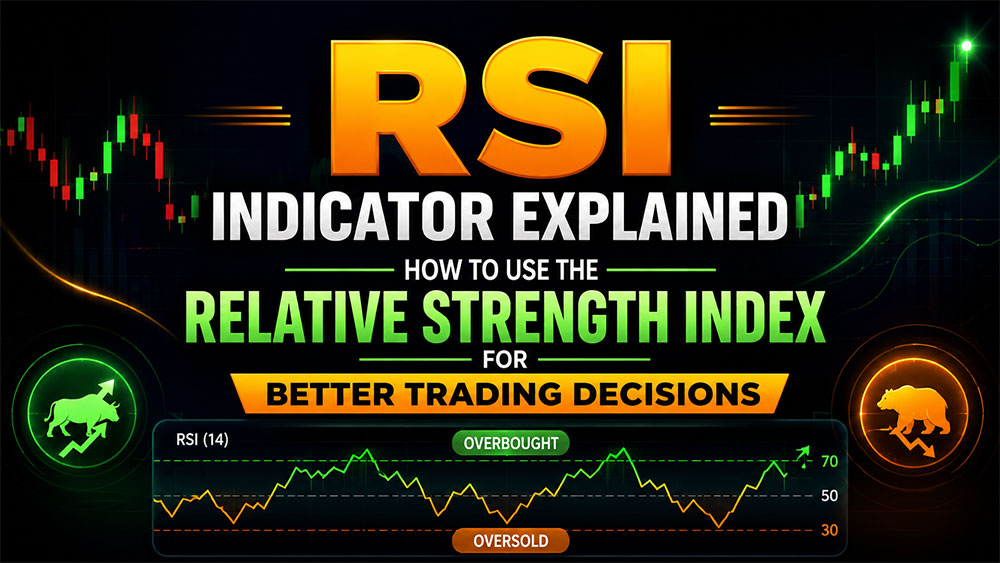
Although Bollinger Bands provide valuable information independently, combining them with complementary indicators significantly improves trading accuracy. The Relative Strength Index (RSI) helps identify overbought and oversold conditions. Therefore, when RSI confirms Bollinger Band signals, traders receive stronger confirmation. The Moving Average Convergence Divergence (MACD) helps validate momentum shifts. The Average True Range (ATR) measures volatility, making it useful for setting realistic stop-loss levels.
Volume indicators reveal whether institutional traders support the current market move. Meanwhile, AI-powered trading platforms increasingly combine Bollinger Bands with machine learning algorithms that analyze historical volatility, liquidity, and order flow to generate higher-probability trading signals. Although AI models enhance pattern recognition, human judgment and disciplined risk management remain essential because no algorithm can eliminate market risk.
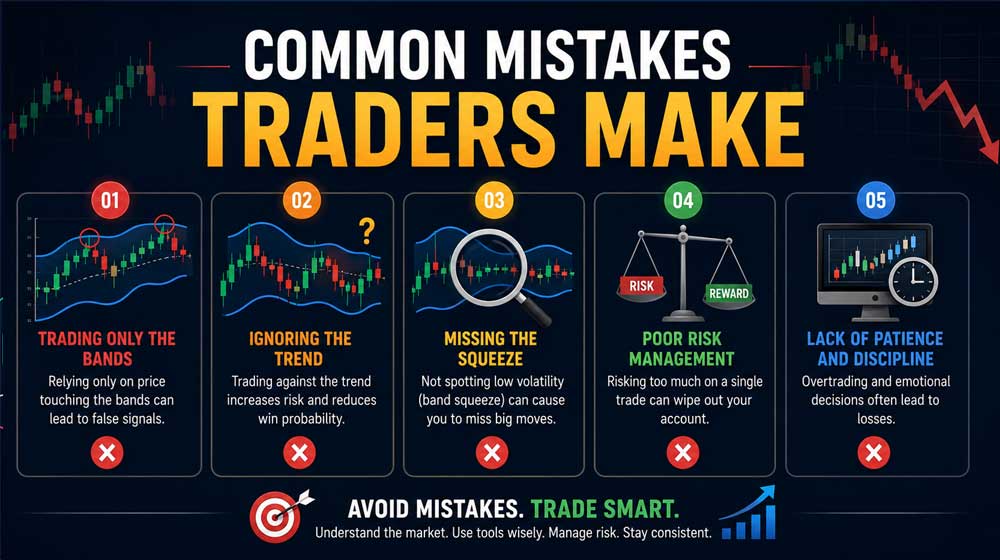
Common Mistakes Traders Make
Many traders lose money not because Bollinger Bands fail, but because they misuse the indicator. The most common mistake involves treating every upper-band touch as a sell signal. Similarly, buying every lower-band touch often results in unnecessary losses during strong downtrends. Another frequent mistake is ignoring the overall market trend. Even excellent Bollinger Band setups perform poorly when traded against dominant market momentum. Overleveraging also remains a significant issue.
No technical indicator guarantees winning trades. Consequently, position sizing and disciplined stop-loss management should always accompany every trading decision.
Risk Management Is More Important Than Any Indicator
Even the most accurate trading strategy cannot succeed without proper risk management. Professional traders understand that preserving capital is their highest priority. Many successful traders risk only a small percentage of their account on each trade while maintaining favorable risk-to-reward ratios. Additionally, they avoid emotional decisions during periods of market uncertainty. Bollinger Bands improve trade selection, but disciplined money management determines long-term profitability.
How AI and Algorithmic Trading Use Bollinger Bands
Modern financial markets increasingly rely on artificial intelligence and quantitative trading systems. Many institutional algorithms incorporate Bollinger Bands alongside volatility models, statistical analysis, trend detection, and predictive machine learning. These systems continuously evaluate thousands of market conditions within milliseconds. Furthermore, AI models analyze historical price behavior, news sentiment, liquidity patterns, and volatility clusters to identify trading opportunities that human traders might overlook.
Retail traders now benefit from similar technologies through advanced trading platforms offering AI-assisted market analysis. Nevertheless, technology should support decision-making rather than replace critical thinking.
Real Market Perspective
Recent market conditions continue to highlight the importance of volatility-based trading strategies. Ongoing central bank policy adjustments, persistent inflation concerns in several economies, and heightened geopolitical uncertainty have contributed to larger price swings across Forex, commodities, equity indices, and cryptocurrencies. In these environments, Bollinger Bands have remained especially valuable because they adapt dynamically to changing volatility instead of relying on fixed price ranges. Traders who combine Bollinger Bands with confirmation from price action, volume, and macroeconomic awareness are generally better equipped to navigate rapidly changing markets than those relying on a single indicator alone.
Who Should Use Bollinger Bands Strategy?
Bollinger Bands are suitable for beginner, intermediate, and experienced traders alike. Day traders use the indicator to identify intraday volatility breakouts. Swing traders use it to capture medium-term market movements. Position traders rely on Bollinger Bands to confirm broader trends. Forex traders monitor currency volatility around economic events.
Stock investors use Bollinger Bands to identify accumulation and distribution zones. Cryptocurrency traders benefit because digital assets experience significantly higher volatility than traditional markets. Regardless of the market, Bollinger Bands provide valuable insights into price behavior when combined with disciplined analysis.
Frequently Asked Questions About Bollinger Bands Strategy
Are Bollinger Bands suitable for beginners?
Yes. Bollinger Bands are relatively easy to understand. However, beginners should practice on demo accounts before trading with real capital and should always combine the indicator with risk management.
Which timeframe works best?
There is no universal timeframe. Day traders often use lower timeframes, while swing and position traders generally rely on higher timeframes for more reliable signals. Multi-timeframe analysis usually produces stronger confirmation.
Can Bollinger Bands predict market reversals?
No. Bollinger Bands indicate volatility and relative price positioning. They do not predict reversals on their own. Confirmation from price action, volume, and other indicators remains essential.
Do professional traders use Bollinger Bands?
Yes. Many professional traders and institutional analysts include Bollinger Bands within broader trading systems that also evaluate trend, momentum, volatility, and market structure.
Improve Your Trading Decisions with Bollinger Bands
Bollinger Bands Strategy continues to be one of the most practical and adaptable tools in technical analysis because it helps traders understand volatility, identify trends, and improve entry and exit decisions. Instead of reacting emotionally to price fluctuations, traders can use Bollinger Bands to evaluate market conditions with greater confidence and consistency.
Success, however, comes from combining the indicator with sound risk management, disciplined execution, and continuous learning. Markets evolve constantly, and traders who adapt their strategies while maintaining a structured approach are more likely to achieve sustainable results.
If you’re looking to strengthen your trading knowledge, explore professional market education, advanced trading tools, and real-time market insights with Millance. Open a demo account to practice Bollinger Bands Strategy in live market conditions, test your approach without risking capital, and build the confidence needed before transitioning to real trading. The right education, combined with disciplined execution, can help transform volatility into opportunity.
Conclusion
Bollinger Bands Strategy continues to be one of the most reliable technical analysis tools for understanding market volatility, identifying high-probability trading opportunities, and improving entry and exit decisions. Rather than relying on assumptions or emotions, traders can use Bollinger Bands to analyze market conditions with greater confidence and make more informed trading decisions.
However, no single indicator guarantees success. The most consistent traders combine Bollinger Bands with strong risk management, price action analysis, market trends, and disciplined execution. As financial markets continue to evolve with AI-driven trading systems, changing economic conditions, and increasing volatility, adapting your strategy and continuously improving your trading knowledge becomes even more important.
If you’re ready to take your trading to the next level, start by practicing the Bollinger Bands Strategy in a risk-free demo account, refine your approach with real-time market analysis, and build the confidence needed before trading live. At Millance, you’ll gain access to advanced trading tools, educational resources, and a secure trading environment designed to help you trade smarter and achieve your financial goals.