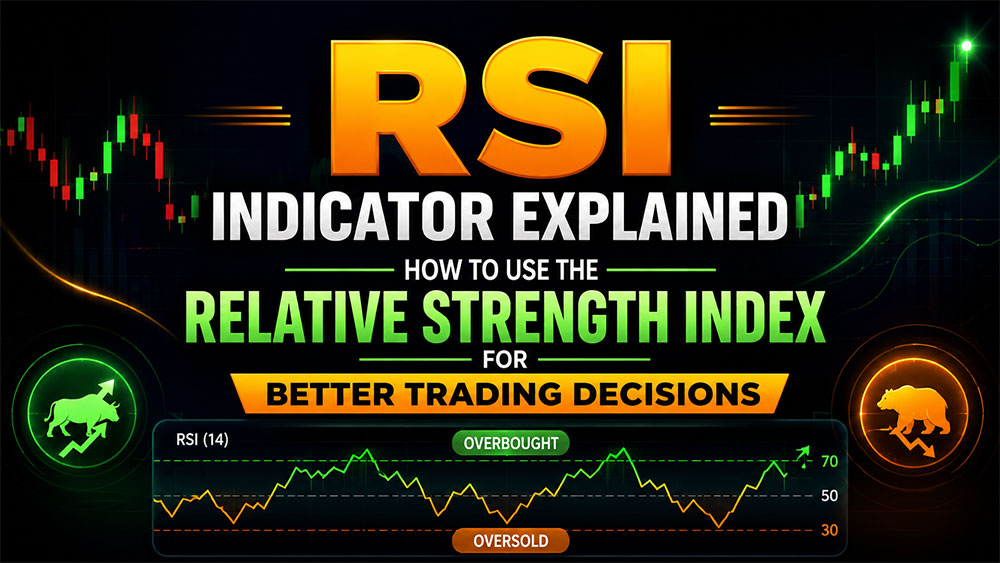

Successful trading is not about predicting every market move. Instead, it is about making informed decisions using reliable data and proven technical indicators. Among the many tools available to traders, the Relative Strength Index (RSI) remains one of the most trusted momentum indicators because it helps identify whether a market may be overbought, oversold, or preparing for a potential reversal.
Many traders struggle with poor entry points, emotional decisions, and false trading signals. As a result, they often buy after a significant price increase or sell immediately after a temporary decline. Consequently, these mistakes can reduce profitability and increase unnecessary risk. The RSI Indicator provides a practical solution by measuring market momentum rather than simply following price movement. When traders understand how RSI works and combine it with sound risk management, they can significantly improve the quality of their trading decisions.
Whether you are a beginner learning technical analysis or an experienced Forex trader refining your strategy, this guide explains everything you need to know about the RSI Indicator in a simple and practical way.
What Is the RSI Indicator?
The Relative Strength Index (RSI) is a momentum oscillator developed by J. Welles Wilder Jr. It measures the speed and strength of recent price movements to determine whether an asset may be overbought or oversold. Unlike indicators that only follow trends, RSI focuses on market momentum. Therefore, it provides valuable insight into whether buying or selling pressure is becoming stronger or weaker. The RSI moves on a scale between 0 and 100, making it easy for traders to interpret changing market conditions.
Generally:
- An RSI above 70 suggests that buying pressure has become extremely strong and the market may be overbought.
- An RSI below 30 indicates heavy selling pressure and potential oversold conditions.
- An RSI near 50 often reflects market balance with no clear momentum advantage.
Although these levels are widely used, professional traders rarely rely on RSI alone. Instead, they combine it with price action, trend analysis, and support and resistance zones to improve accuracy.

Why the RSI Indicator Is Still Popular Among Professional Traders
Financial markets have evolved significantly over the past decade. High-frequency trading, algorithmic systems, artificial intelligence, and automated execution now dominate many trading environments. Nevertheless, the RSI Indicator continues to remain one of the most widely used technical analysis tools.
The reason is simple. RSI measures momentum, and momentum drives every financial market. Whether traders are analyzing Forex pairs, indices, commodities, or stocks, understanding momentum helps them identify when buyers or sellers are beginning to lose control. Instead of reacting emotionally to every price movement, traders use RSI to evaluate whether current market conditions support a potential trade. Because of this, RSI is frequently included in professional trading strategies, institutional chart analysis, and algorithmic trading models.
How Does the RSI Indicator Work?
The RSI compares recent average gains with recent average losses over a selected time period. The most common setting is 14 periods, which means the indicator analyzes the previous fourteen candles before calculating its value. If buyers dominate during those periods, the RSI moves higher. Conversely, if sellers dominate, the RSI moves lower.
Rather than measuring price direction directly, RSI measures the strength of recent price movement. This distinction is extremely important. For example, a currency pair may continue rising while the RSI begins falling. This tells traders that buying momentum is weakening even though the trend has not yet reversed. As a result, traders receive an early warning that market conditions may soon change.
Understanding the RSI Formula
The RSI calculation is based on the relationship between average gains and average losses. The simplified process includes:
First, calculate the average upward price movement. Next, calculate the average downward price movement. Then compare both values to determine the Relative Strength (RS). Finally, convert the result into an index ranging from 0 to 100. Fortunately, modern trading platforms such as MetaTrader 5 (MT5) perform these calculations automatically.
Therefore, traders can focus entirely on interpreting signals rather than performing mathematical calculations. Understanding the logic behind the formula is still important because it helps traders recognize why RSI reacts differently during strong trends and ranging markets.
Best RSI Settings for Forex Trading
One of the biggest questions beginners ask is whether the default RSI settings should be changed. For most Forex traders, the answer is no. The standard 14-period RSI remains the preferred choice because it balances responsiveness with reliability. However, different trading styles often require different settings. Scalpers frequently use shorter RSI periods such as 7 or 9 because these respond more quickly to rapid price changes. Swing traders often continue using the standard 14-period setting because it filters much of the market noise.
Long-term investors sometimes increase the RSI period to 21 or even 25 to identify stronger momentum shifts over longer timeframes. Rather than searching for a “perfect” RSI setting, traders should focus on maintaining consistency within their strategy. Changing settings after every losing trade usually leads to poor decision-making.
Understanding Overbought and Oversold Conditions
The most widely recognized RSI signals involve overbought and oversold levels. An RSI reading above 70 often indicates that buying pressure has accelerated rapidly. Many beginners immediately interpret this as a sell signal. However, experienced traders understand that markets can remain overbought for extended periods during strong bullish trends.
Similarly, an RSI below 30 reflects intense selling pressure. Again, this does not automatically guarantee that prices will reverse immediately. Instead, these levels indicate that traders should begin watching for confirmation from price action. For example, if RSI falls below 30 while price reaches a major historical support level, the probability of a reversal may increase significantly.
Confirmation remains the key. RSI should guide trading decisions rather than make them automatically.
Why Traders Use the RSI Indicator
Every trader wants answers to three important questions:
Is momentum increasing? Is momentum weakening? Could the current trend soon reverse? The RSI helps answer all three. Rather than guessing market direction, traders receive objective momentum data based on recent price behavior. This provides several advantages. First, RSI helps traders avoid emotional buying during market excitement. Second, it prevents panic selling during temporary corrections. Third, it improves trade timing by highlighting periods where momentum begins changing before price fully reacts. Consequently, traders gain additional confidence when entering or exiting positions.
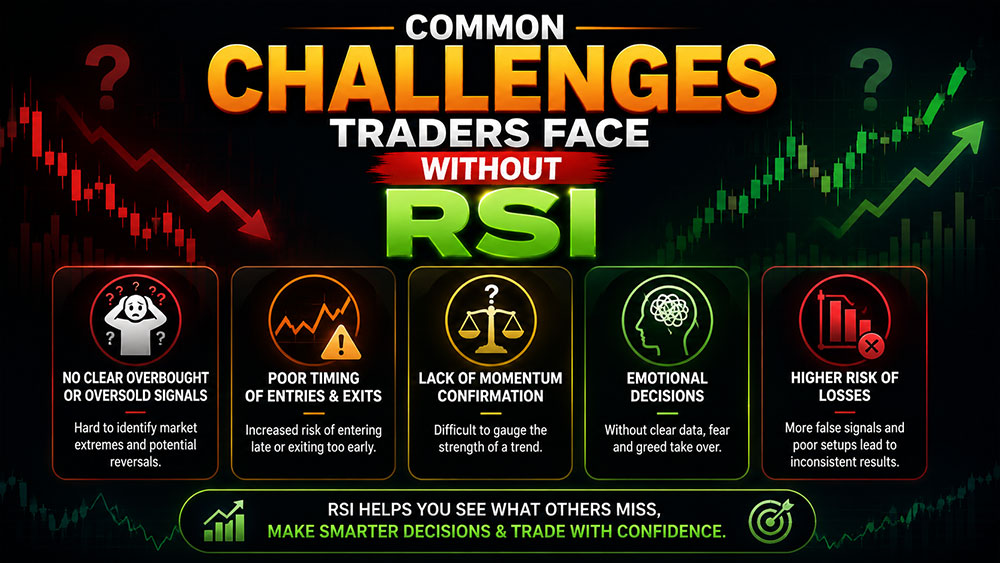
Common Challenges Traders Face Without RSI
Many traders lose money not because they lack knowledge but because they lack structure. One common mistake involves chasing strong bullish candles after prices have already risen significantly. Unfortunately, this often results in buying near temporary market tops. Another common problem involves selling after sharp declines out of fear. In many cases, the market quickly rebounds, leaving traders frustrated.
The RSI helps reduce these emotional decisions by providing measurable momentum data instead of relying on fear or excitement. Although no indicator guarantees profitable trades, using RSI within a disciplined trading plan helps traders improve consistency and reduce impulsive decision-making.
Real-World Example
Imagine that EUR/USD has been rising steadily for several trading sessions. The RSI climbs above 75. Instead of immediately opening a sell trade, an experienced trader waits for additional confirmation. Soon afterward, the price reaches a major resistance zone while bullish candles begin showing smaller bodies. At the same time, RSI starts moving lower even though price continues making slightly higher highs.
This combination suggests that buying momentum is weakening. Rather than reacting emotionally, the trader patiently waits for a bearish confirmation candle before considering a short position. This disciplined approach reduces unnecessary risk while improving trade quality.
Advanced RSI Trading Strategies That Deliver Better Results
Learning how to read the RSI is only the beginning. The real advantage comes from understanding how professional traders use it alongside other technical analysis tools instead of treating it as a standalone signal. One of the biggest reasons traders lose money is because they assume that an RSI above 70 always means “sell” and an RSI below 30 always means “buy.” Unfortunately, markets rarely behave that simply. Strong trends can keep the RSI in overbought or oversold territory for extended periods, causing traders to enter positions too early.
A more effective approach is to use the RSI as a confirmation tool rather than a decision-maker. When combined with trend direction, support and resistance levels, candlestick patterns, and proper risk management, RSI becomes significantly more reliable. Professional traders focus on probability instead of certainty. Therefore, they wait for multiple technical factors to align before placing a trade. This disciplined approach reduces emotional decisions and improves consistency over the long term.
How to Identify RSI Divergence Before Major Market Reversals
One of the most valuable features of the RSI Indicator is its ability to identify divergence. Divergence occurs when price movement and RSI movement begin telling different stories. This often signals that momentum is weakening, even if the current trend still appears strong.
Bullish Divergence
Bullish divergence happens when the market creates a lower low while the RSI forms a higher low. This suggests that selling pressure is decreasing even though prices continue falling. As a result, buyers may soon regain control, increasing the possibility of an upward reversal. For example, imagine GBP/USD declining for several sessions. Price reaches a fresh low, but the RSI no longer follows it lower. Instead, it begins climbing. This change in momentum often gives experienced traders an early warning that bearish strength is fading.
Bearish Divergence
Bearish divergence occurs when price records a higher high while the RSI creates a lower high. Although prices continue rising, buying momentum is weakening. Consequently, the market becomes more vulnerable to a correction or trend reversal. This setup is especially powerful when it develops near significant resistance levels or after an extended bullish trend. Rather than entering immediately, traders usually wait for additional confirmation such as bearish candlestick formations or a break below short-term support.
Combining RSI with Moving Averages for Better Trade Confirmation
One of the most effective ways to improve RSI accuracy is by combining it with Moving Averages. Moving Averages help identify the overall market trend, while RSI measures momentum. Together, they provide a more complete picture of market conditions. Suppose the 200-period Moving Average indicates a strong uptrend. Instead of selling whenever RSI reaches 70, traders look for RSI pullbacks toward 40–50 before searching for new buying opportunities.
Likewise, during strong downtrends, traders often wait for RSI to recover toward 50–60 before looking for fresh selling opportunities. This approach keeps traders aligned with the dominant market direction while avoiding unnecessary counter-trend trades.
Using RSI with Support and Resistance Levels
Support and resistance remain among the most important concepts in technical analysis. When RSI signals appear near these key levels, their reliability often improves. Imagine EUR/USD approaching a long-term support zone while RSI drops below 30. At the same time, bullish rejection candles begin forming. Instead of buying solely because RSI is oversold, traders now have three independent confirmations:
- Price has reached historical support.
- RSI indicates selling momentum is weakening.
- Candlestick patterns suggest buyers are entering the market.
This combination increases confidence while reducing the likelihood of entering weak setups. The same principle applies near resistance when RSI becomes overbought.
How RSI Behaves During Strong Trending Markets
Many beginners misunderstand RSI because they expect every overbought or oversold reading to trigger an immediate reversal. However, strong trends behave differently. During powerful bullish trends, RSI often remains between 60 and 80 for extended periods. Rather than signaling weakness, this reflects healthy buying momentum.
Similarly, during strong bearish markets, RSI frequently stays below 40 while prices continue falling. Experienced traders understand this behavior. Instead of fighting the trend, they use RSI pullbacks as opportunities to join it. Trading with the trend generally offers higher-probability opportunities than attempting to predict reversals.
How RSI Performs in Sideways Markets
Unlike trending markets, ranging markets produce frequent price reversals. This is where RSI often performs exceptionally well. When prices repeatedly bounce between support and resistance, RSI overbought and oversold signals become much more reliable because momentum naturally shifts within the established range.
For example, if USD/JPY repeatedly trades between two well-defined price levels, RSI readings below 30 near support may present attractive buying opportunities. Likewise, RSI readings above 70 near resistance may signal potential selling opportunities. Understanding the market environment before interpreting RSI dramatically improves decision-making.
Common RSI Trading Mistakes and How to Avoid Them
Many traders blame the RSI when trades fail. In reality, the problem usually lies in how the indicator is used. The most common mistake is relying exclusively on RSI without considering market structure. No technical indicator should operate in isolation Another frequent error involves entering trades immediately after RSI reaches 70 or 30 without waiting for confirmation. Momentum alone does not guarantee a reversal. Some traders also change RSI settings constantly after losing trades. This creates inconsistency and makes strategy evaluation impossible.
Risk management is another area where many traders struggle. Even the strongest RSI setup can fail if unexpected news or high market volatility shifts sentiment. Successful traders accept that losses are part of trading. Their goal is not to win every trade but to manage risk while maintaining long-term profitability.
How AI and Modern Trading Technologies Use RSI
Artificial intelligence has transformed financial markets by enabling faster data analysis and automated decision-making. Even so, the RSI remains an important component within many algorithmic trading systems. Rather than relying solely on RSI values, AI-powered trading models evaluate multiple factors simultaneously, including trend direction, trading volume, volatility, support and resistance levels, market sentiment, and macroeconomic events.
By integrating RSI into broader analytical frameworks, these systems reduce false signals and improve decision quality. Retail traders can apply the same principle. Instead of depending on a single indicator, combining RSI with complementary technical tools creates a more balanced and effective trading strategy.
Frequently Asked Questions About the RSI Indicator
What is the best RSI setting for Forex trading?
The 14-period RSI remains the industry standard because it offers a strong balance between responsiveness and reliability. Shorter settings react faster but may produce more false signals, while longer settings provide smoother momentum analysis.
Is RSI suitable for beginners?
Yes. RSI is one of the easiest technical indicators to understand. However, beginners should use it alongside trend analysis, support and resistance, and proper risk management rather than relying on it alone.
Does RSI work on every timeframe?
Yes. RSI can be applied to one-minute charts, hourly charts, daily charts, and even weekly charts. However, higher timeframes generally produce more reliable signals because they filter out short-term market noise.
Can RSI predict market reversals?
No. RSI highlights changes in momentum rather than predicting the future. It helps traders identify conditions where reversals may become more likely, but confirmation from price action is essential.
Is RSI effective for all financial markets?
Yes. RSI is widely used across Forex, stocks, commodities, indices, and cryptocurrencies because momentum plays an important role in every actively traded market.
Final Thoughts
The Relative Strength Index has remained one of the most trusted technical indicators because it helps traders understand something price alone cannot always reveal—market momentum. Used correctly, RSI can improve trade timing, reduce emotional decision-making, and strengthen overall market analysis. However, its true value comes from combining it with trend analysis, support and resistance, candlestick confirmation, and disciplined risk management.
Successful trading is not about finding a perfect indicator. It is about building a structured process that consistently identifies high-quality opportunities while protecting trading capital. Whether you are just starting your Forex journey or refining an existing strategy, mastering the RSI Indicator can become an important step toward making more confident and informed trading decisions.
Start Trading Smarter with Millance
Ready to apply the RSI Indicator in live market conditions?
At Millance, you can access the powerful MetaTrader 5 (MT5) platform, advanced charting tools, competitive spreads, and a secure trading environment designed for traders of all experience levels.
Open your trading account today and begin practicing RSI strategies with real-time market data.
👉 Explore More: https://millance.com/
👉 Open Your Trading Account: Register